Reanalyzing public trial data
A depression-trial example shows how independent calculations, careful source checks, and missing-data sensitivity make an analysis easier to assess.
Scope: This is a reanalysis of a public teaching release containing 100 records. The cited trial randomized 167 adults; how the released records were selected is unresolved. This case does not establish a full-trial treatment effect or a successful replication of the original publication.
The question
Beating the Blues is a computerized cognitive-behavioural programme evaluated against usual care. In the released data, how do depression scores differ after accounting for baseline symptoms? How much does the answer depend on the follow-up visit and assumptions about missing scores?
We first checked the two-month complete records, then fitted a longitudinal model using all available follow-up measurements. Independent Python and R implementations checked the calculations.
The early estimate is clearer than the later ones
At two months, the longitudinal model estimated a 3.95-point lower depression score for Beating the Blues: -3.95 points, with a 95% bootstrap interval from -7.13 to -0.77. At eight months the interval includes no difference. These estimates do not establish sustained benefit, a decline in benefit, or a difference between visits.
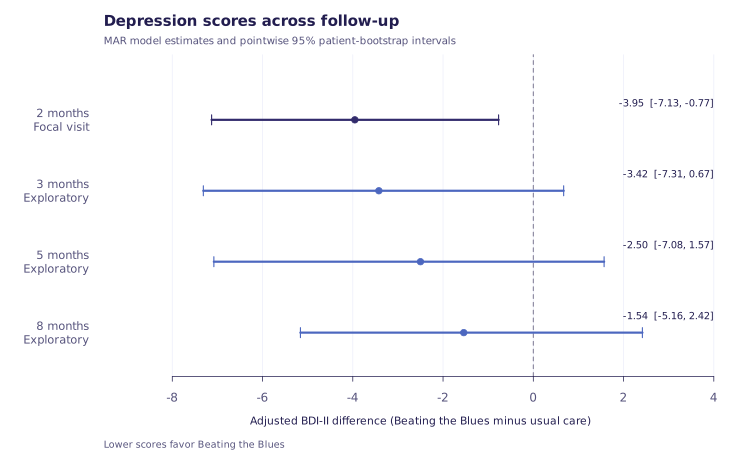
Scroll the plot horizontally, or open the results table below.
Download figure (PNG)Download figure (SVG)Download results table
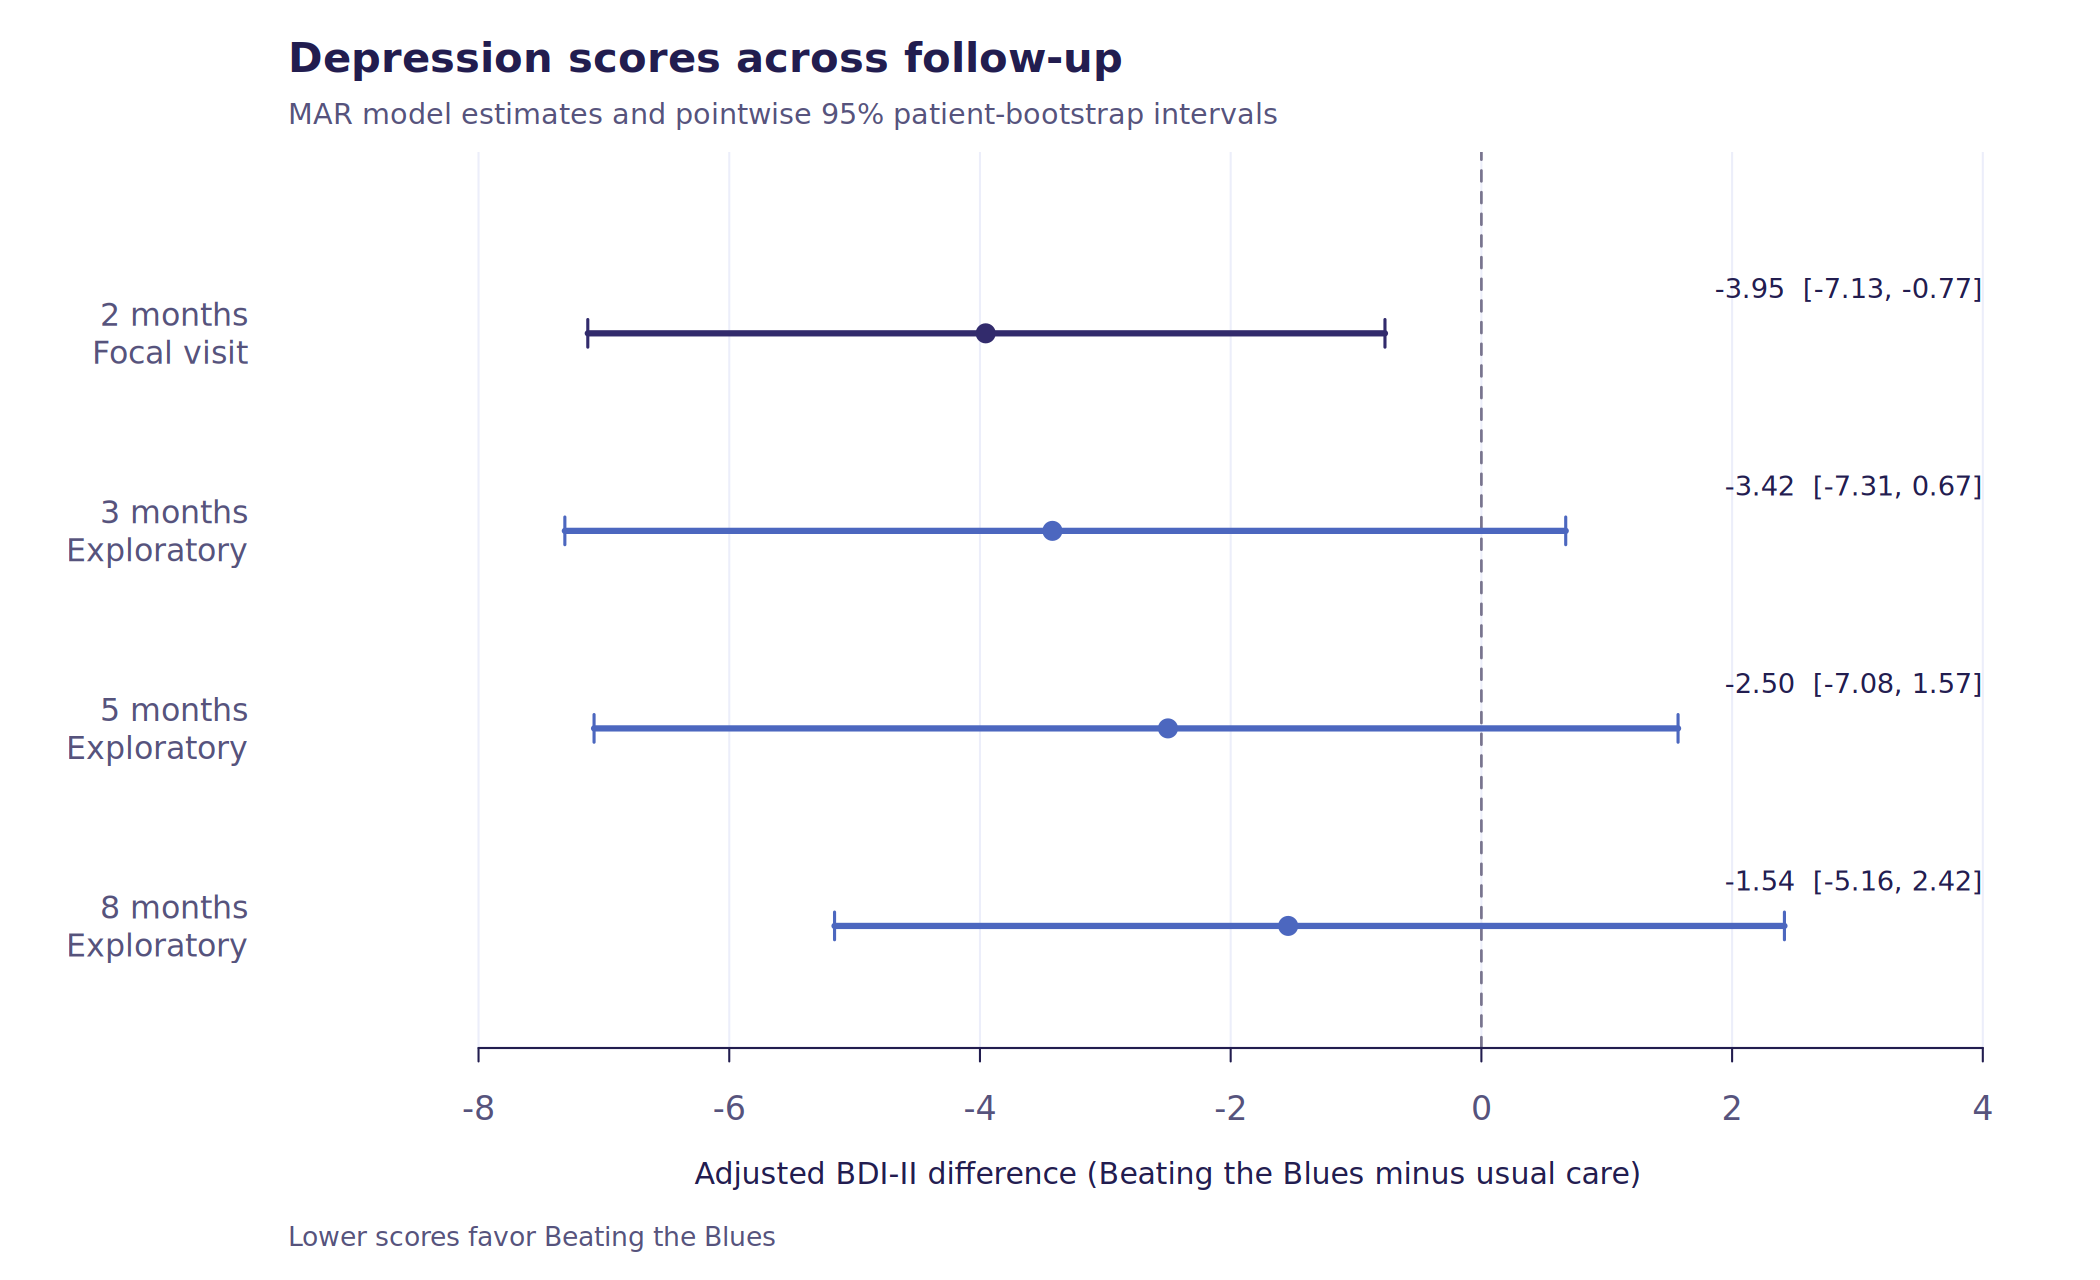
Read the numbers and model details
| Months from baseline | Adjusted difference | 95% interval |
|---|---|---|
| 2 | -3.95 | -7.13 to -0.77 |
| 3 | -3.42 | -7.31 to 0.67 |
| 5 | -2.50 | -7.08 to 1.57 |
| 8 | -1.54 | -5.16 to 2.42 |
The Gaussian likelihood uses a separate treatment effect and baseline slope at each visit, with an unstructured within-patient covariance. There are 280 observed follow-up scores. No clinic effects or precision weights were invented. The separate two-month complete-record ANCOVA uses HC3 inference and has a different interval; the figure shows only the longitudinal model.
What we checked
Source meaning
We pinned the data version and checked assessment timing. A conflict in teaching-slide labels was resolved using the named columns, package help, and study schedule.
Computational agreement
R independently refitted the model and every Python bootstrap sample. Agreement checks implementation; it does not verify the clinical assumptions.
Missing-score assumptions
We shifted expected missing scores under 25 illustrative scenarios. The two-month interval stayed below zero within that grid; later estimates were sensitive.
What this case can support
This example demonstrates a documented, independently checked reanalysis. It also shows why a public dataset needs a clear analysis population and an explicit missing-data model before its results can be interpreted.
The missing-score shifts were illustrative, not clinically established bounds. Software agreement cannot establish MAR, model adequacy, or representativeness of the released records. Practice identifiers are unavailable, and exact numerical agreement with the original clinical paper has not been assessed.
Inspect and reproduce the analysis
The curated package includes Python/R source, analysis plans, aggregate reference results, the figure and its data, software versions, and SHA-256 checksums. Participant records and internal review reports are excluded. Public-source acquisition is a separate, hash-checked step.
Full numerical replay requires Linux, Python 3.12 and R 4.4.3 with the pinned packages. The README distinguishes the primary check from the full bootstrap replay.
Download reproducibility package · 541 KBZIP SHA-256: a99774c63dfe2948186cd88f78edc9a305a5a421cddd69f54e0c5b7bf22176d6Sources and attribution
- Proudfoot et al. (2003). Computerized, interactive, multimedia cognitive-behavioural program for anxiety and depression in general practice. Original trial context; our review does not reproduce its exact analysis.
- Hothorn and Everitt. HSAUR3 1.0-16, BtheB teaching release. Data source and documentation; package declares GPL-2. Dataset files are acquired separately, not included in the download.
- DASS prepared the reanalysis and explanatory material. DASS was not the original trial team. The download documents the retrospective specification, numerical checks and remaining limits.